Coding

the download on my upskill

I have spent my life being curious. I have re-invented myself a few times, sometimes needing to take a step back so I can take two steps forward. I enjoy this process, learning something new and taking on a new challenge. A process engineer is a data scientist at heart, so in 2020 I decided to enhance my skillset and learn more about data science and programming. I balanced a full-time job while attending an intensive 24-week Data Analytics & Visualization evening and weekend program at U.C Berkeley Extension. I focused on gaining technical programming skills in Python, HTML, CSS, JavaScript, SQL and Machine Learning - achieving new superpowers.

Languages & (Libraries): Microsoft Excel VBA, Python (Pandas, Matplotlib, Beautiful Soup, NumPy), Bootstrap 4 HTML and CSS, JavaScript (D3, Leaflet, Plotly)

Tools: Tableau, Github, Jupyter Notebooks, VS Code, JMP, Matlab, SolidWorks, Microsoft Office, Balsamiq, Lucid Charts, Final Cut Pro X, Atlassian products (Confluence, Jira, Trello)

Databases: PostgresSQL – pgAdmin 4, NoSQL – MongoDB, Snowflake

Coding Experience

A collection of my coding
projects and experience

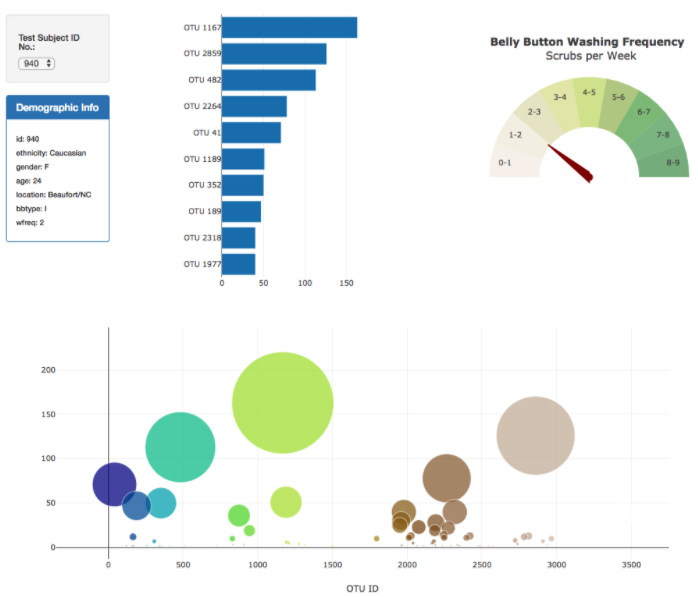
Data Visualization with Plotly

Built an interactive dashboard in HTML, CSS, JavaScript, Plotly utilizing a Flask connection to explore a dataset that analyzed Belly Button Bacteria Biodiversity. The tool catalogs the microbes that colonize human navels.

The dataset revealed that a small handful of microbial species - taxonomic units, or OTU's were present in more than 70% of people, while rare in the remaining 30%.

Mapping with Leaflet and APIs

Developed a mapping tool in HTML, CSS, JavaScript, Leaflet with an API connection to the USGS live GeoJSON feed in order to visualize earthquake data and correlate to issues that impact our planet. Developed mapping layers to distinguish occurrence with amplitude and date/time stamps. Learned how to layer different types of maps - satellite, grayscale, outdoors and also ability to toggle ON/OFF fault lines and earthquake responses.

SQL Challenge: Data Modeling, Engineering & Analysis

Evaluated a Kaggle employee dataset and designed tables to hold data within a CSV and import into a SQL database. Learned how to create ERDs and schemas to auto populate data table column headers and prep for data dumps. Utilized PostgresSQL to evaluate tables and test SQL queries.

Machine Learning

This project incorporated almost everything I learned from my data science bootcamp. I formed a group with four other classmates to develop an interactive website that would give the user current and historical weather information, along with campground availability and critical informational notices from most major National Parks in the U.S mainland. The purpose of this site is to help the user determine optimal vacation plans based on their preferences. We also incorporated machine learning concepts, using a KNN (k-nearest neighbors) prediction algorithm to predict which National Park the user may be interested in visiting based on previously visited parks and a small dataset we built based on a user survey.